Native Advertising Statistics 2026: What 635,443 Live Ads Tell Us
First-party native advertising statistics for 2026, from live capture rather than surveys: 635,443 creatives, 27,256 advertisers and 5.87M observations across 46 networks — per-network volumes, the finance-led vertical mix, a majority non-English language split, and a longevity curve where 89% of creatives die within ~10 days.

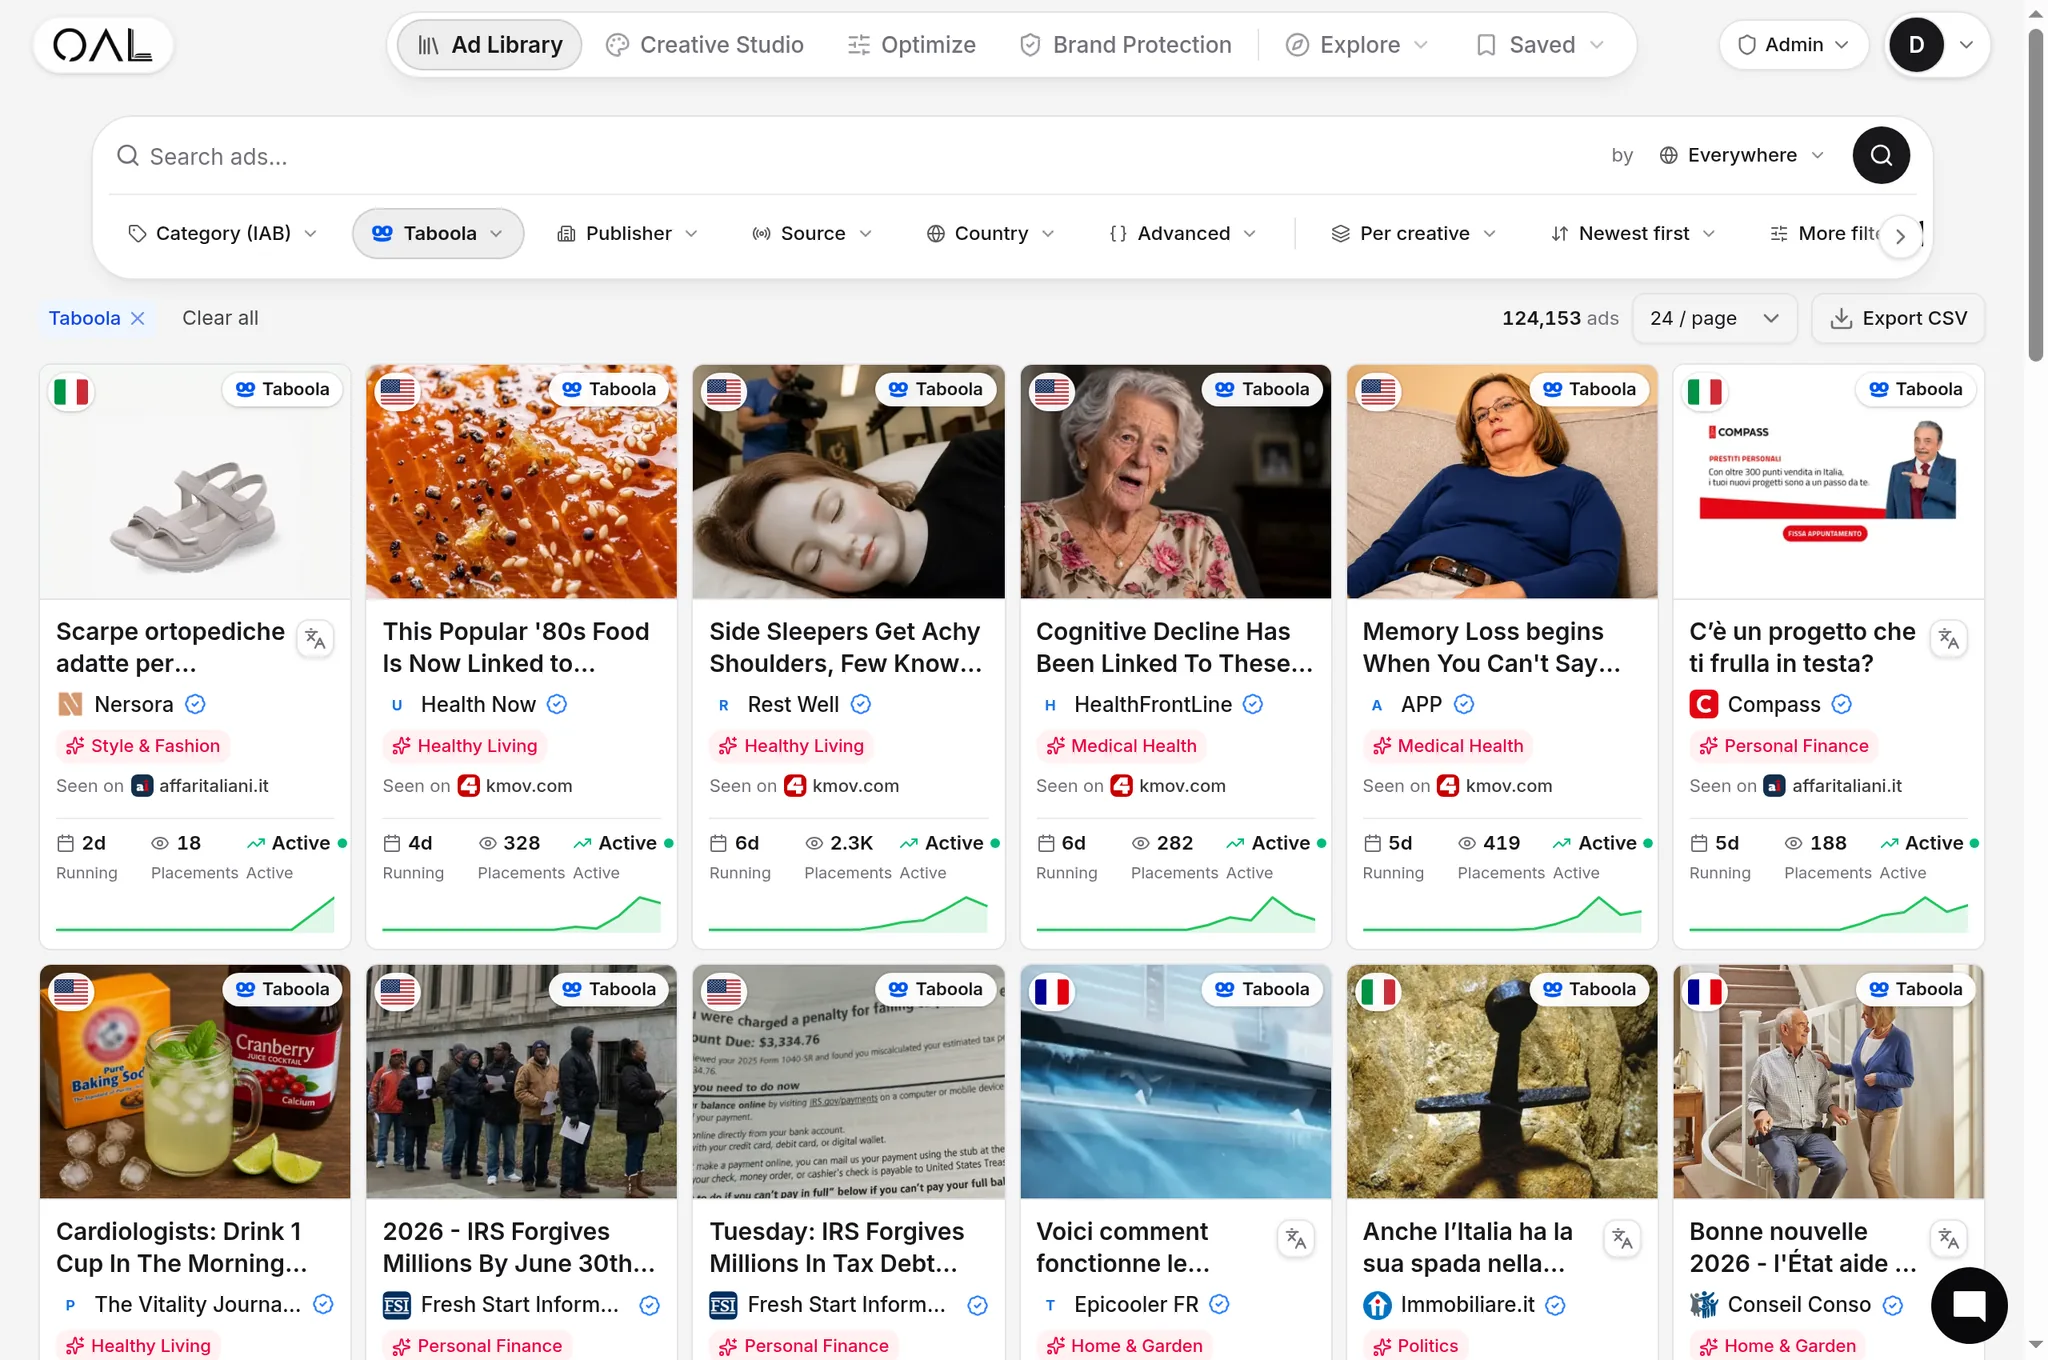
Most native advertising statistics pages recycle the same decade-old survey findings ("70% of people prefer to learn about products through content"). This one doesn't. Every number below comes from live ad capture: as of July 2026, OpenAdLibrary monitors 46 native ad networks via direct API collection and holds 635,443 creatives from 27,256 advertisers, with 1,081,997 landing page captures and 5,874,698 ad observations behind them. These are counted ads you can individually inspect, not survey estimates.
Cite freely with attribution ("OpenAdLibrary, July 2026"). Each stat is written to stand alone, so you can lift a single sentence with its number intact. A methodology section with caveats is at the end; the macro narrative lives in our companion State of Native Advertising 2026 report.
The page covers seven dimensions: headline totals, per-network volumes (library and fresh 30-day output), the vertical mix, the language split, creative longevity, top advertisers per network, and feed turnover — followed by two externally sourced market-size figures for context. Everything else you read about native advertising volume is either a survey, a vendor claim, or an extrapolation; these are counts.
Headline statistics#
- OpenAdLibrary's index contains 635,443 live-captured native ad creatives as of July 2026.
- Those creatives belong to 27,256 distinct resolved advertisers — an average of roughly 23 creatives per advertiser.
- The index spans 46 native ad networks, from Taboola and Outbrain to the Microsoft Audience Network, MGID, Revcontent, MediaGo and Yahoo.
- 1,081,997 landing pages have been captured by following ad click chains to their true destinations — about 1.7 landing captures per creative.
- 5,874,698 individual ad observations (sightings of a creative in a live feed) back the index — an average of 9.2 observations per creative, and the raw material for every longevity figure below.
| Metric | Value (July 2026) |
|---|---|
| Live creatives captured | 635,443 |
| Distinct advertisers | 27,256 |
| Networks monitored | 46 |
| Landing page captures | 1,081,997 |
| Ad observations | 5,874,698 |
Network volumes: who fills the feeds#
- The Microsoft Audience Network is the largest single source of fresh native creatives: 257,553 creatives first seen in the last 30 days — more than any other network we track, and roughly 41% of attributed fresh volume. (Deep dive: MSN native ads guide.)
- Taboola produced 167,524 fresh creatives in the last 30 days, from a total library of 171,050 captured Taboola creatives.
- Outbrain (now Teads) produced 91,341 fresh creatives in 30 days — about 55% of Taboola's fresh output — from a 92,290-creative library.
- MGID produced 54,391 fresh creatives in 30 days (54,585 in the library).
- Revcontent produced 12,672 fresh creatives in 30 days (12,821 in the library).
- MediaGo, Baidu's international native DSP, produced 6,035 fresh creatives in 30 days.
- Yahoo/Verizon native produced 4,709 fresh creatives in 30 days, with long-tail exchange sources — Google Ad Manager (2,185), IPONWEB (1,801), SuperEdge (1,571) and Xandr (1,408) — rounding out the fresh mix.
- The Microsoft Audience Network's fresh volume (257,553) exceeds Taboola and Outbrain combined (258,865) within rounding distance — a two-horse-plus-one race nobody writes about.
| Network | Fresh creatives (last 30 days) |
|---|---|
| Microsoft Audience Network | 257,553 |
| Taboola | 167,524 |
| Outbrain (Teads) | 91,341 |
| MGID | 54,391 |
| Revcontent | 12,672 |
| MediaGo | 6,035 |
| Yahoo / Verizon | 4,709 |
| Google Ad Manager | 2,185 |
| IPONWEB | 1,801 |
| SuperEdge | 1,571 |
| Xandr | 1,408 |
| Unattributed | 28,124 |
Vertical mix: what native ads sell#
- Finance is the #1 native advertising vertical with 18,727 classified creatives in the OpenAdLibrary index as of July 2026.
- Insurance is #2 with 17,177 creatives — finance and insurance together account for 35,904 creatives, the largest classified bloc in native. (Live examples: finance native ads.)
- Health ranks #3 with 16,511 creatives, ahead of ecommerce (14,952) and entertainment (13,370) — the "nutra owns native" folklore does not survive contact with classification data, as we showed in our vertical deep-dive.
- Vertical mix diverges sharply by network: health leads Taboola (6,857 creatives), insurance leads Outbrain (2,999), and entertainment utterly dominates MGID (10,225 — 15x its second category, health at 696). No single network's mix resembles the channel-wide ranking, which is why single-network vertical studies mislead.
| Vertical | Creatives (index-wide) |
|---|---|
| Finance | 18,727 |
| Insurance | 17,177 |
| Health | 16,511 |
| Ecommerce | 14,952 |
| Entertainment | 13,370 |
| Software | 11,711 |
| Travel | 11,263 |
| Home & Garden | 8,384 |
| Fashion | 6,778 |
| Auto | 6,658 |
Language split: native is not an English-only channel#
- English accounts for 251,633 language-classified creatives — but that is only 49% of the top-15 language total. Native advertising is a majority non-English channel once you leave the US SERP bubble.
- German is the #2 native ad language with 61,469 creatives, followed by Spanish (40,955), French (38,325), Portuguese (20,236) and Italian (19,104).
The long tail matters more than it looks: Hebrew (10,630), Japanese (9,188), Korean (9,180) and the Nordic languages each sustain five-figure or high-four-figure live creative pools — enough for a serious advertiser to study proven angles before entering any of these markets. Almost all English-language competitive research ignores this entire half of the channel.
| Language | Creatives | Language | Creatives |
|---|---|---|---|
| English | 251,633 | Polish | 10,945 |
| German | 61,469 | Hebrew | 10,630 |
| Spanish | 40,955 | Japanese | 9,188 |
| French | 38,325 | Korean | 9,180 |
| Portuguese | 20,236 | Swedish | 8,370 |
| Italian | 19,104 | Norwegian | 6,843 |
| Dutch | 13,399 | Greek | 6,476 |
| — | — | Finnish | 6,451 |
Creative longevity: how fast native ads die#
The most misunderstood numbers in native. We track first-seen and last-seen dates for every image creative; bucketing observed lifespans in 10-day bands gives:
- 88.9% of native image creatives disappear within roughly 10 days of first being sighted (566,670 of 637,514 tracked creative lifespans).
- 8.8% of creatives survive 10-20 days (56,097 creatives).
- Only 2.3% of native creatives run 20 days or longer (14,747 creatives), and just 330 — 0.05% — have been observed past the 30-day mark.
- A creative that survives three weeks is therefore in roughly the top 2% of all native ads — which is why days-running is the single strongest public signal that an ad is profitable. (Method: ad longevity as a winning signal; hall of fame: the longest-running native ads.)
| Observed lifespan | Creatives | Share |
|---|---|---|
| ~0-10 days | 566,670 | 88.9% |
| ~10-20 days | 56,097 | 8.8% |
| ~20-30 days | 14,417 | 2.26% |
| ~30+ days | 330 | 0.05% |
Important caveat: our per-network observation window opened roughly 30 days before this snapshot, so long-run shares are conservative — a creative shown as "31 days" has run at least 31 days, and the 20+ day cohort will grow as the window extends. The die-fast finding is robust; the exact tail shares are floors, not ceilings.
Top advertisers by network#
- The single most prolific advertiser in the index is Yahoo Search on Taboola with 4,184 creatives in 30 days — search-arbitrage demand, not a consumer brand.
- On MGID, content-arbitrage domains dominate: itsvividleaves.com (3,088 creatives) and factripple.com (3,071) are the network's two biggest advertisers.
- The biggest classical direct-response advertiser we track is OTTO Insurance, with 2,337 Taboola creatives and a longest-observed creative of 30 days.
- Comparison-shopping brands run multi-network portfolios: Comparisons.org fields 1,095 creatives on Taboola and 1,179 on Revcontent simultaneously; HomeBuddy runs 874 (Taboola) plus 844 (Revcontent).
- Top advertisers rotate creatives at industrial scale — the top 10 advertiser-network pairs alone account for over 24,000 creatives, yet almost all of their creatives still die within the index-wide 10-day norm.
Concentration is real but not extreme: with 27,256 advertisers behind 635,443 creatives, the median advertiser is small, and even the #1 advertiser-network pair (Yahoo Search on Taboola) holds under 1% of the index. Native remains a long-tail marketplace — one where a few dozen portfolio operators (comparison shops, arbitrage networks, insurance lead-gen) are nonetheless visible from orbit once you can group creatives by resolved advertiser rather than by the brand label painted on the card.
| Network | Top advertisers (creatives, 30d) |
|---|---|
| Taboola | Yahoo Search (4,184) · WonderMapped (2,543) · OTTO Insurance (2,337) |
| MGID | itsvividleaves.com (3,088) · factripple.com (3,071) · Insulux Diabetic Support (1,807) |
| Outbrain | EpiCooler (1,203) · Weedmaps (893) · thinkstreamed.com (590) |
| Revcontent | Ribili (2,186) · Comparisons.org (1,179) · HomeBuddy (844) |
Full advertiser rankings and per-advertiser drill-downs: top native advertisers by network and who advertises on Taboola.
Feed turnover and capture depth#
Comparing each network's total captured library against its fresh 30-day output reveals how fast native feeds replace themselves:
- The Taboola feed effectively replaces itself every month: 167,524 of its 171,050 captured creatives (98%) were first seen within the last 30 days.
- The same is true across the majors — Outbrain's fresh share is 99% (91,341 of 92,290), MGID's is 99.6% (54,391 of 54,585) and Revcontent's is 98.8% (12,672 of 12,821). A "library" of native ads that isn't continuously recaptured is a museum within weeks.
| Network | Library (total captured) | Fresh (30d) | Fresh share |
|---|---|---|---|
| Taboola | 171,050 | 167,524 | 98.0% |
| Outbrain (Teads) | 92,290 | 91,341 | 99.0% |
| MGID | 54,585 | 54,391 | 99.6% |
| Revcontent | 12,821 | 12,672 | 98.8% |
| MediaGo | 6,509 | 6,035 | 92.7% |
- Each creative in the index is backed by an average of 9.2 live-feed observations (5,874,698 observations across 635,443 creatives) — the repeated sightings that make first-seen/last-seen longevity measurement possible.
- Landing pages outnumber creatives: 1,081,997 landing captures against 635,443 creatives (~1.7x), because the same creative frequently rotates through multiple pre-landers and tracker destinations.
- The index currently carries 66 active copycat landing-page alerts — cases where a captured landing page substantially clones another brand's page, surfaced by our brand-protection detection.
Industry context (external sources)#
For sizing the market around these observations, two third-party forecasts are worth citing alongside our capture data:
- US native display ad spending is forecast to grow 13.1% in 2026 to $147.98 billion, per eMarketer's December 2025 forecast.
- The global native advertising market is estimated at $125.6 billion in 2026, per Future Market Insights' 2026-2036 outlook — with the usual spread across research houses (Market Research Future, for comparison, models ~$125 billion for 2025 growing at ~12.4% CAGR).
We treat external market-size figures as context only; every other number on this page is first-party capture data.
What the 2026 data actually means#
Six takeaways that don't show up in survey-based stat pages:
- The biggest native feed is the one with no ad library. Microsoft's Audience Network out-produces every other network in fresh creatives, yet has no official transparency surface — and barely any coverage. That asymmetry is a research edge for whoever bothers to look.
- Native is a churn machine with a tiny evergreen core. Nine in ten creatives die inside ~10 days. The ~2% that survive past 20 days are where the validated angles live — which is why sorting by longevity beats sorting by recency for finding winning ads.
- The advertiser mix is stranger than the pitch decks say. The #1 advertiser is a search engine buying arbitrage traffic; two of MGID's top three are content farms. Consumer brands share the feed with an entire traffic-trading economy.
- Half of native isn't in English. Angle-testing in German, Spanish or French markets against 60K/41K/38K live creatives is a genuinely under-used playbook, especially for scaling into new geos.
- Any static snapshot of this channel is stale in weeks. With the major feeds refreshing 98-99% of their creatives per month, competitive research built on screenshots or quarterly reports is structurally behind. Continuous capture isn't a nice-to-have for this channel; it's the minimum viable methodology — and it's why the spy-tool category exists at all.
- Verticals sort by compliance, not just audience. Finance and insurance cluster on premium networks (Taboola, Outbrain, Microsoft) whose publisher tier regulated advertisers can defend; entertainment-labeled quiz-and-curiosity volume floods the permissive ones (MGID's 10,225-creative entertainment bloc). Reading a network's vertical mix is the fastest way to understand its true policy posture, whatever its sales deck says.
For media buyers, the actionable summary is shorter still: pick networks by where your vertical already concentrates, judge competitors by creative survival rather than creative volume, and treat the Microsoft feed as the largest under-researched pool of native inventory in the market right now.
Methodology#
What OpenAdLibrary captures. OpenAdLibrary continuously collects native ad creatives (image, headline, brand label), placement observations, and click-chain data from 46 native advertising networks, including Taboola, Outbrain/Teads, the Microsoft Audience Network, MGID, Revcontent, MediaGo and Yahoo. Collection is API-based — we request the same ad feeds publishers' pages request, across desktop, Android and iOS device profiles and multiple geos — rather than screenshot-scraping rendered pages. Click chains are unwrapped through tracker redirects to resolve the true advertiser and landing page; landing pages are captured and stored (1,081,997 captures to date).
Snapshot and windows. All figures are a July 2026 snapshot. "Fresh" counts creatives first seen in the trailing 30 days. Longevity is computed from first-seen/last-seen dates per image creative, bucketed in 10-day bands. Advertiser identity is resolved by unwrapping tracker redirects and deduplicating brand labels, so "27,256 advertisers" counts entities, not display names.
Caveats. (1) Creative counts measure creative production, not spend — high-rotation advertisers weigh more than steady ones. (2) Our per-network observation window began roughly 30 days before this snapshot, so lifespan tails are lower bounds. (3) Vertical classification covers a subset of the index (verticals are assigned from traced landing pages, resolved advertisers, copy and imagery — counts reflect classified creatives only). (4) Language stats reflect creatives with detected language, top 15 shown. (5) Geo coverage follows our monitored markets and expands over time; per-network shares can shift as coverage does. (6) 28,124 fresh creatives are currently unattributed to a network pending click-chain resolution.
Verification. Every statistic on this page can be reproduced in the product: browse the index with network, vertical, language and longevity filters, or start free (200 ads, no card). The individual creatives cited across our example galleries — Taboola, finance — are inspectable the same way, image by image. Journalists and researchers: cite as "OpenAdLibrary, July 2026" and link this page; for programmatic access see our native ad data API. We plan to refresh this page as the observation window lengthens, so bookmark the URL rather than the numbers.